TCO Estimator - Guide to optimizing VMware Cloud on AWS deployment using FSx for ONTAP Datastores
Cloud adoption continues to evolve, and every organization is exploring the easiest and cost-efficient way to start their cloud journey. One of the most successful approaches that is adopted by organizations is to leverage existing capabilities, tools and expertise and simplify their migration or disaster recovery journey. Such an option is VMware Cloud on AWS which significantly reduces the adoption and migration time to the Cloud. Like in any cloud journey, while it is easy to get started, the important aspect to size it accurately.
To provide guidance on sizing and TCO of new VMC SDDCs for customer initiatives require understanding the current VMware deployment and assessment of workloads using appropriate tools to rightsize the deployment and set up on the cloud adoption journey. In terms of sizing VMC SDDC hosts, there is no simple answer since it depends on how many virtual machines and applications will be running on the host and then on the cluster. A database, for instance, has high transactional I/O requirements and a large memory footprint, while a fileserver or stateless web/application server does not. The virtual machine profile varies based on the workload type.
Let’s consider the following scenario: a customer requires eight hosts for horsepower (vCPU/vMem), but they also have a substantial requirement for storage. Based on their assessment, they require 16 hosts to meet storage requirements. This increases the overall TCO because they must buy all that additional horsepower when all they really need is more storage.So how to size this thing.
The NetApp TCO estimator, which uses the VMC sizer as the foundation can be found here. An easy-to-use tool that offers insights into sizing aspects of the storage, simplifying and optimizing deployment. This article describes how to use the estimator and easily project how many hosts are required for a deployment and calculate the savings to optimize the deployment using Amazon FSx for NetApp ONTAP as a supplemental datastore to meet both performance and capacity requirements while complementing vSAN in a true hybrid storage model in the cloud.
Getting Started
- Open https://bluexp.netapp.com/vmc-aws-fsx-ontap/roi on a new browser.
- Select the Region and Sizer input method.
- Choose Manual input (equivalent to quick sizing). Another option is select Import RVTools file for more accurate sizing based on collected data.
- RVTools - RVTools is a free Windows .Net application that connects directly to any existing vSphere environment and exports a current snapshot of the inventory. This snapshot does not include storage performance requirements. It uses the vCenter API to generate an excel sheet file that contains the details on every VM in the environment. By uploading the file, more accurate estimation can be performed because the sizer contains details of every VM configurations.
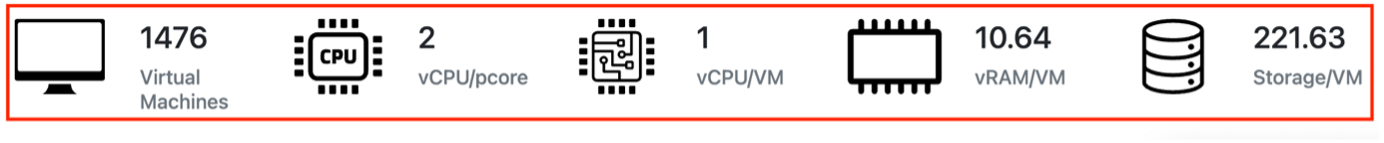
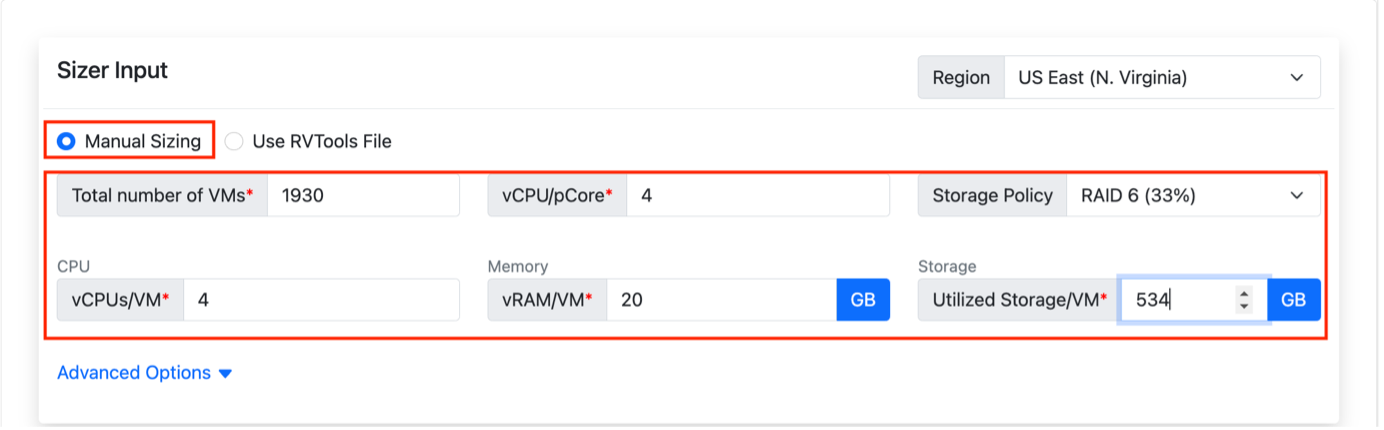
- Update the input parameters (Total number of VMs, vPCU/pCore, vCPU/VM, vRAM/VM, storage/VM.
- Update FSx for ONTAP parameters.
- Click Submit to generate the recommendation.
As you can see, the process is simple. Next, let’s look at how it works, and avoid any myths about miscalculations.
How it works:
The TCO estimator leverages VMware sizer APIs to perform a POST along with the input payload to “https://vmc.vmware.com/vmc/sizer/api/v2/recommendation". The response payload for the same provides the recommendation based on the inputs provided. This information is then parsed, and the number of hosts suggested is used to calculate the total cost of ownership. This provides the VMC TCO leveraging vSAN which comes by default with each host. The subsequent API call is made to rightsize with CPU/Mem parameters to optimize the storage model so FSx for ONTAP can be added to complement existing vSAN storage and thus reduce the required host count. Once the second API request's response payload is received, two parallel API calls are triggered, one to AWS pricing calculator for FSx for ONTAP to add the cost of projected capacity and another to VMware pricing calculator to retrieve the latest pricing information including discounts to provide an accurate host count and TCO estimation. These make up the entire sizing process irrespective of the input model.
Demonstration with example
The common concern while sizing is the collection of input data. There is no specific tool and rule of thumb in this case. The data can be from manual estimates, RVtools or any third-party assessment tools that provides the necessary inputs. If performance sizing is important, then VMware Aria operations, Live optics, Cloud insights or data from any APM tool can be used. The most common input methods used are RVtools and Live optics.
Now let’s walkthrough the sizing workflow using a real time data. This example is using RVtools.
- Open https://bluexp.netapp.com/vmc-aws-fsx-ontap/roi on a new browser.
- Select the Region and Sizer input method.
- Choose Use RVTools File and click on Choose file to upload RVtools file.
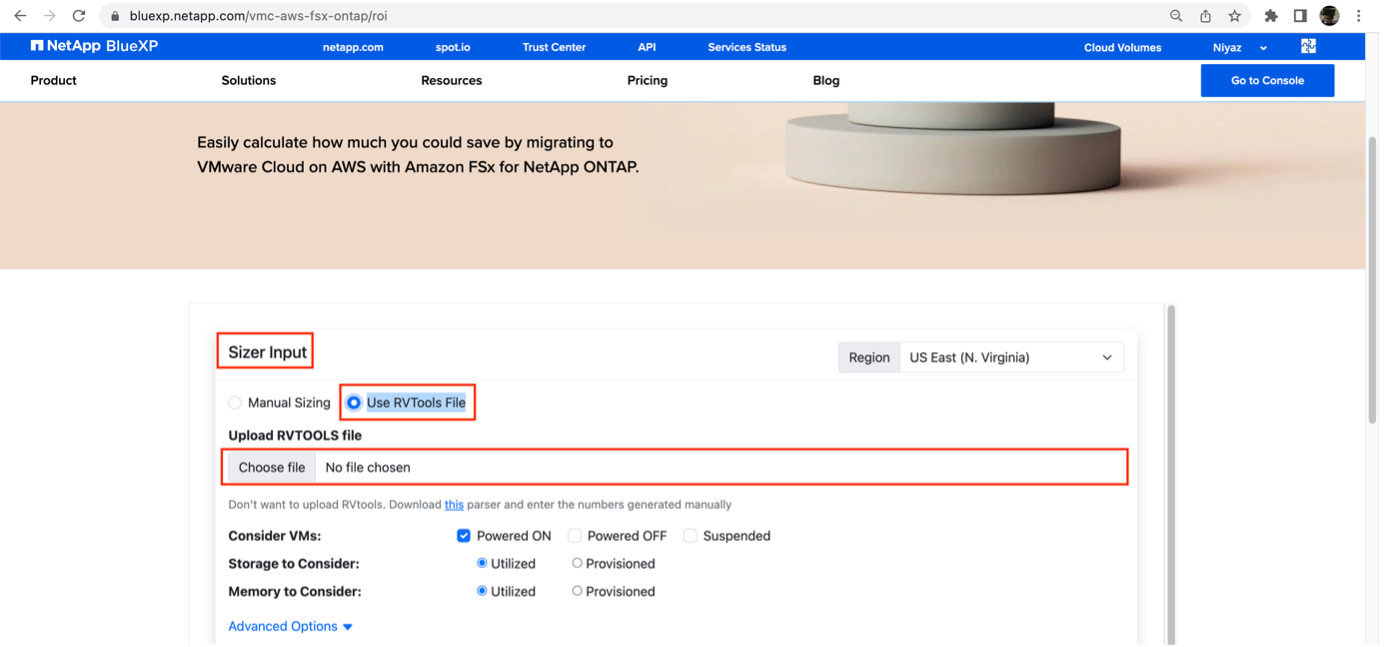
Note: If RVtools cannot be uploaded due to data sharing policies, use the parser available which parses the data within your network and the same can be used for sizing by selecting the “Manual Sizing” option.
- Update the considerations for parsing RVtools.
- The recommendation is to select Powered ON and OFF VMs.
- The storage to consider should be Utilized. Utilized means total capacity used measured across all drives on the guest VMs. Provisioned can be selected depending on the requirements.
- The memory to consider for sizing should be Utilized
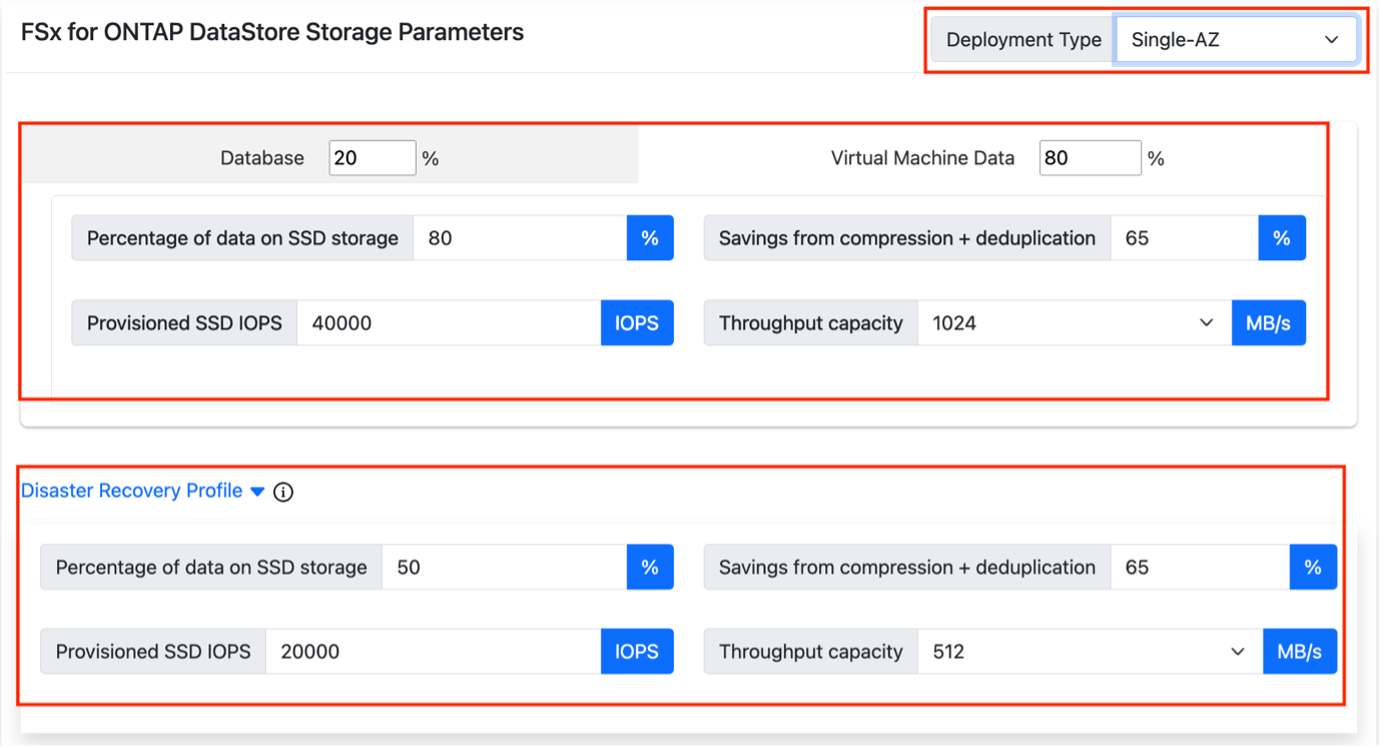
- Update the FSx for ONTAP storage parameters.
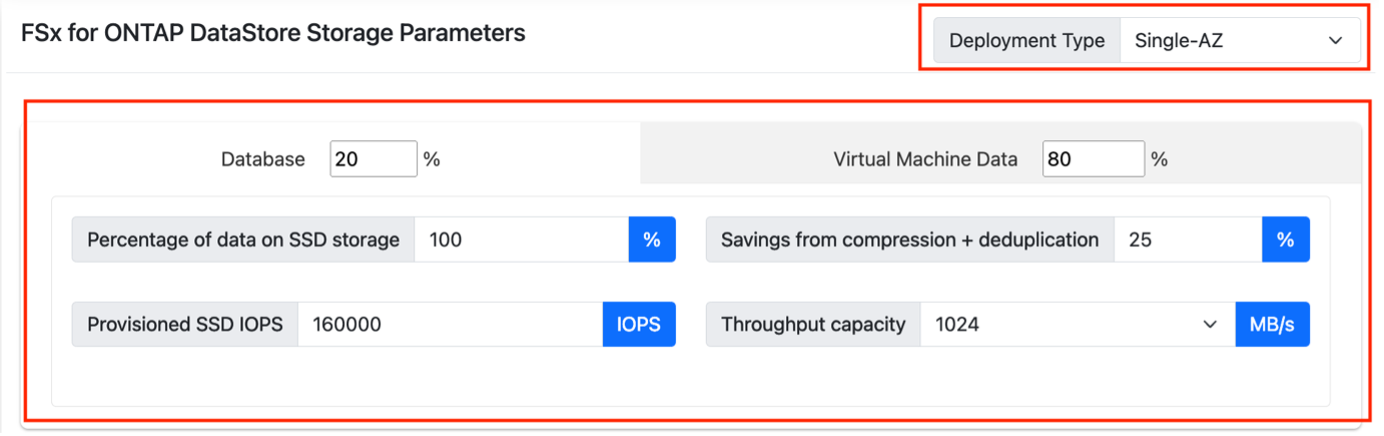
- Deployment type – Single AZ by default
Note: Majority of the deployments use Single AZ FSx for ONTAP file systems.
Note: FSx for ONTAP is not supported with stretched clusters - Define the workload profile. The approach here is to size the file system for the appropriate IOPs and throughput based on app specific workloads. Since any kind of data collection tool doesn’t provide default workload annotations, a guesstimate is used here. The assumption is 20% of data stored on FSx for ONTAP datastore will be database workload and the remaining 80% is generic workload. This can be modified to suit specific customer needs. If no additional data point exists, use the default values.
Note: This part requires more attention. It provides two different profiles (database and virtual machine data as default profiles), but these could be any majority workloads in the customer environment, such as VDI and generic VM workloads, or even 100% general VM workloads
- Percentage of data on SSD storage
The recommendation is to keep 100% on SSD. However, if the workload data involves cold data (purely based on data points and inputs from specific app owners). Tiering should be enabled only for snapshots for Tier 0 and Tier 1 NFS workload datastores. For the rest, tiering can be set to Auto.
- Savings from compression + deduplication
The default value is 65% for generic VM workload and can range upto 80%. This value is derived based on the efficiency gains seen by on-premises customers. While generic VM workload can see significant benefits, database workloads would provide lower savings, hence consider any value between 15-25%.
If sizing needs to be conservative, then consider 40%.
- Provisioned SSD IOPS
Modify the SSD IOPs based on the IOPs required. The IOPs can be modified anytime to the max achievable for each SKU type depending on the requirements. Amazon FSx for ONTAP automatically provisions 3 SSD IOPs per GB for the file system, up to a maximum of 160,000 SSD IOPS per file system. Keep in mind, the maximum level of SSD IOPS that a file system can achieve is also dictated by the file system's throughput capacity, even when provisioning additional SSD IOPS.
- Throughput capacity
Modify the throughput capacity to suit the needs. If no data is available, use 1GB SKU. Remember, the throughput capacity can be modified on the fly with a single click. If the workload access pattern is known and performs random reads, then 2GB or 4GB can be specified to take advantage of flash cache capabilities for Single AZ file systems. If using Multi-AZ, flash cache is available for all SKUs.
- Deployment type – Single AZ by default
- Disaster Recovery Profile
- Percentage of data on SSD storage
The recommendation is to keep 50% on SSD and use the Auto tiering policy.
- Savings from compression + deduplication
The default value is 65% for generic VM workload and can range up to 80%.
- Provisioned SSD IOPS
Modify the SSD IOPs based on the IOPs required. The IOPs can be modified anytime to the max achievable for each SKU type depending on the requirements once the DR is activated.
- Throughput capacity
Modify the throughput capacity to suit the needs. For DR usecases, keep the throughput to a smaller SKU and then upgrade when disaster event is triggered.
- Percentage of data on SSD storage
- Transit Gateway Attachment
For Single AZ deployments, VPC peering is used and hence TGW calculations are disabled. In the case of Multi AZ deployments, data flows from the datastore mounted on the ESXi host within VMC SDDC via the VMware Transit Connect. So TGW calculations will be enabled. If “Auto calculate” is used, the estimator considers 20% of the total FSx for ONTAP capacity as the change rate and numbers are auto calculated based on it.
- Select the savings options that should be used in the calculations.
- Click Submit
Once the sizing request is submitted, the payload is sent to the VMC sizer and TCO calculations are applied on the projected numbers.
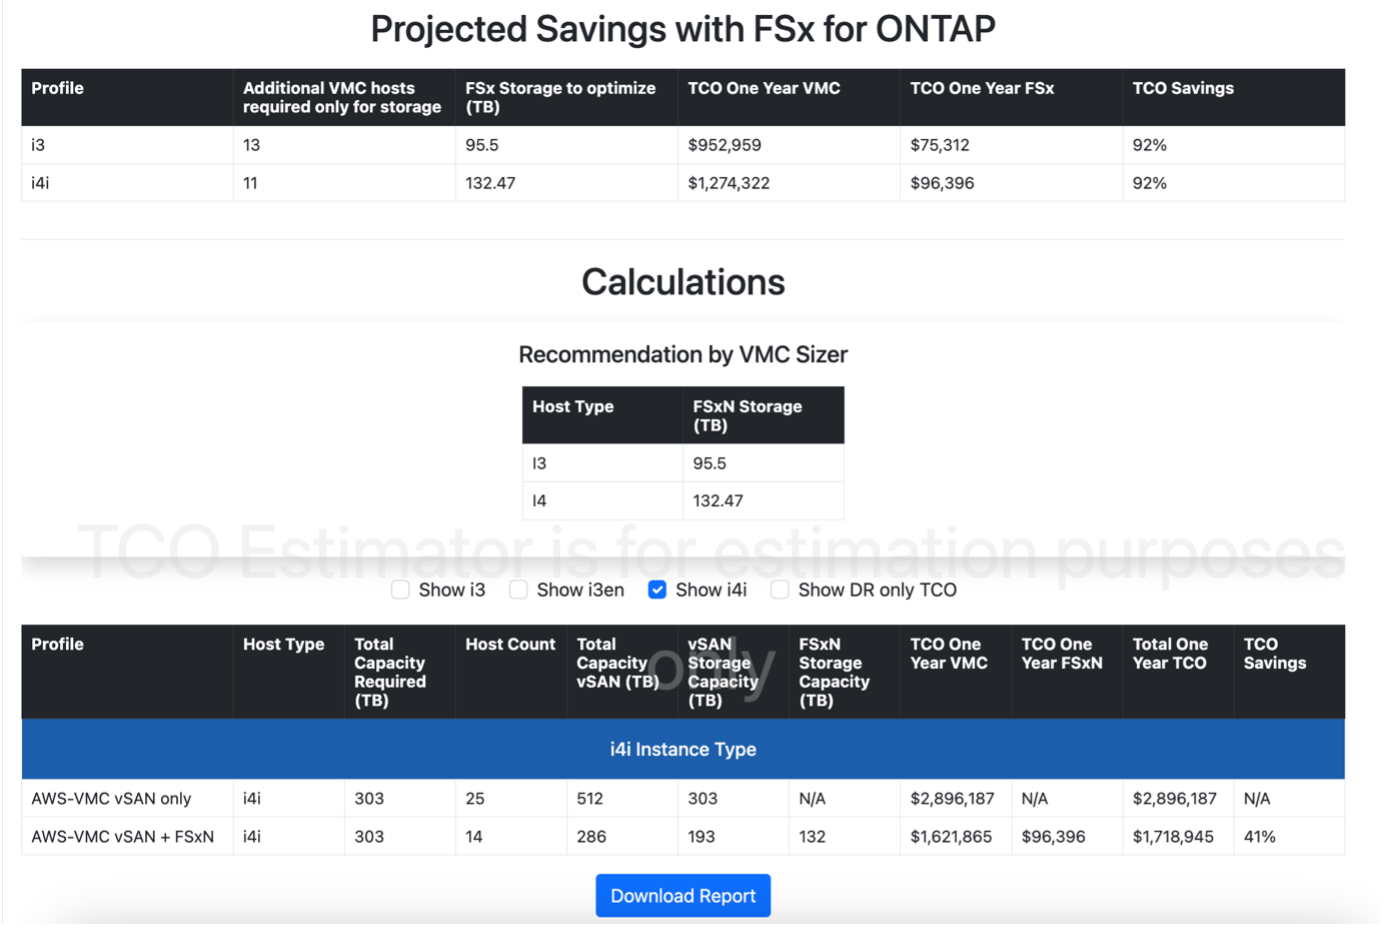
Demystifying Output table
The first table shows the direct comparison between ESXi hosts required vs FSx for ONTAP capacity to meet the requirements. So, in essence, the estimator replaces the ESXi hosts that are added for storage needs with FSx for ONTAP.
In this demo example, instead of using 11 i4i hosts, 133TiB of FSx for ONTAP can be provisioned to achieve a TCO optimization of 92%.
The second table shows the overall TCO comparison across vSAN only sizing vs reduced vSAN hosts + Fsx for ONTAP to complement the deployment and optimize it.
Note: Always use the first table for comparison to show host vs FSx for ONTAP to project the savings.
Now, it’s time to validate the workflow and overcome any myths wrt sizing estimations projected. To accomplish this, let’s use the same rvtools input sheet with the VMC sizer.


The screenshot above shows the numbers are identical on both VMC sizer and NetApp TCO estimator as it is an API exchange for the necessary information. The same can be proven with any RVtools file. The benefit of using NetApp TCO estimator is to quickly show savings in terms of hosts vs FSx for ONTAP capacity and off course the TCO percentage which helps in enabling customers to make an informed first step.
Another Example of sizing (using Manual inputs)
In this example, let’s look at how to size an opportunity with details from on premises vROPs monitoring, which will be used as manual inputs in the sizer.
Problem statement
Our customer has a datacenter migration project. The number of virtual machines is 1930, with an average of 3 vCPU, 20GiB memory and 534 GiB storage (aggregated). Using the VMC Sizer, this requires 137 hosts to provide about 1 PB of used storage.

In this example, the vROPS report was exported which captured IOPS for over a month.
Based on probing the customer, in this example, the customer had 368 database VMs out of 1930 which equates to 160 TiB out of 1 PiB. This makes up 19% of the total virtual machines and approximately 16% of the storage. (For simplicity, we will round this up to 20%).
Based on vROPs data, the sustained IOPS for those database VMs is 40,000 (this is from the customers vROPS report). The IO size from the report is 16KB, which equates to 650 MBps. To handle 650 MBps requirement, the throughput capacity for the ”Database” profile should be set to 1024 MBps and set the percentage of SSD to 100%.
Keep in mind, deploying the above config would be on multiple clusters, meaning the 160TB will be spread across 2 datastores. With the latest version of FSx for ONTAP, a single 300TB volume can be created, which means the entire capacity can be fit onto a single datastore volume.
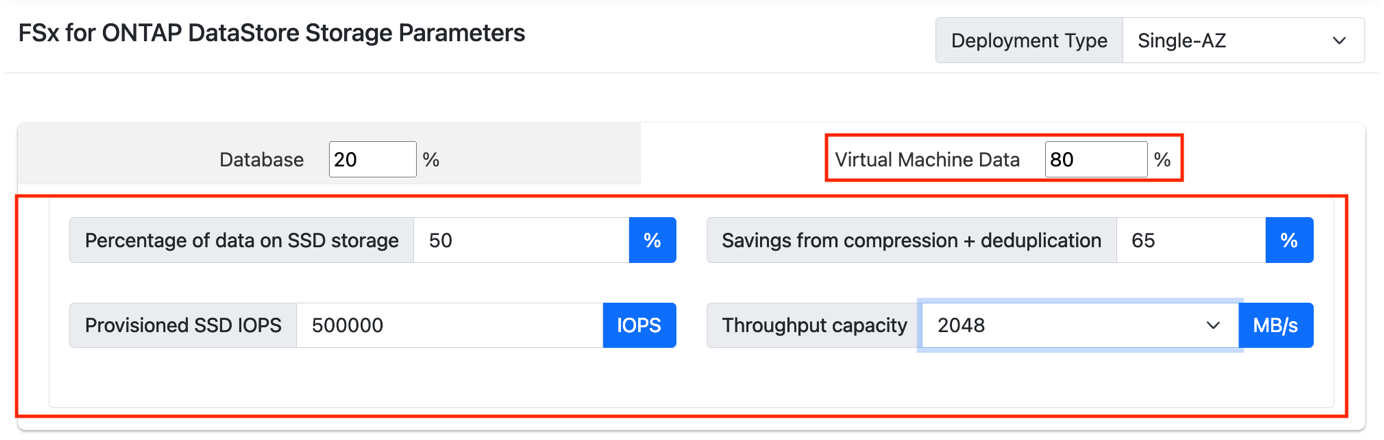
The second subset of workloads is all marked as "Virtual Machine Data”. These are considered as general-purpose workloads that make up the remaining 80% of the customer’s production environment. These workloads have sustained IOPS of 170,000 with a 12KB average IO size (also taken from vROPs). This equates to 2048 MBps.
In this example, 534GB per VM is used. However, according to the customer, an average of half of the storage is being used. Therefore, SSD percentage is set at 50%.
Click on Submit, the sizer will show the output along with TCO comparison.

As covered earlier, the first line under the calculations shows the host count required with vSAN only without using Amazon FSx for NetApp ONTAP, in this case 84 i4i nodes. The second line shows FSx for ONTAP complementing vSAN and optimizing the deployment using just 34 hosts and 587TB on FSx for ONTAP. The table shows the TCO for one year. Since Single AZ FSx for ONTAP is used, there is no transit gateway cost.
The above real time scenario shows that using Amazon FSx for NetApp ONTAP with VMware Cloud on AWS can lead to strong cost reduction for customers.
These examples are for estimation purposes and the costs could vary depending on the customer environment and the inputs provided.
Recommendations
- Use Single-AZ FSx for ONTAP for production deployments.
- Use RVtools for initial sizing.
- Consider using Avg values when sizing for performance.
- With nconnect, each datastore can provide ~1GBps throughput
- Use multiple datastores and segregate the workload based on IOPs/capacity demands.
Additional Information
In the event, the deployment requires Multi-AZ for availability or application specific reasons, please find below the method to estimate the TGW costs. The estimator will auto calculate it. However, if production data is available, please use them for manual sizing and update the TGW section.
TGW calculation:
Note: This section is only applicable when Mulit-AZ file system is used. Single AZ file systems uses a VPC peering mechanism.
Consider a real-time scenario wherein data egress on VMware Cloud on AWS SDDC is 133MB/s and data egress from FSx for NetApp ONTAP is 140MB/s, then the net data transfer is 273 MB/s. This would equate to 23.5TB of data per day spread across two TGW attachments.
Total data processed per all Transit Gateway attachments: 23,5TB x 30 days = 705TB per month. Let us convert to GB: 705TB x 1024 GB = 721,920 GB per month.
Pricing calculations*
- Total Monthly Transit Gateway attachments cost: 730 hoursin a month x 0.05 USD* = 36.50 USD x 2 TGW attachments = 73 USD.
- Total Monthly Transit Gateway data processing cost: 721,920 GB per month x 0.02 USD = 14,438.4 USD.
- Total Transit Gateway monthly cost: 73 USD attachments cost + 14,438.4 USD data processing cost = 14,511.4
The total cost for TGW for the scenario outlined above, estimated monthly cost is 14,511.4 USD.
About the Authors
Authors:- Niyaz Mohamed (NiMo), Principal Architect, Cloud & Hybrid Cloud Solutions, NetApp
- Vedant Sethia, Technical Marketing Engineer and Automation Specialist, Cloud & Hybrid Cloud Solutions, NetApp
- Kiran Reid, Senior Partner Solutions Architect, AWS